Felix Immanuel

An Engineer with 6+ years of experience as a Business Analyst. Adept in EDA and Machine Learning. Has a sound knowledge of Agile and Scrum.
View My LinkedIn Profile
Kaagle.com - Titanic: Machine Learning Competition
Project description:
This is the legendary Titanic ML competition from Kaagle.com – the challenge was to dive into ML competitions and familiarize myself with how the Kaggle platform works.
The competition is to: use machine learning to create a model that predicts which passengers survived the Titanic shipwreck.
The data has been split into two groups:
- Training set
- Test set
1. Dataset Overview
tit.head()

   PassengerId  Survived  Pclass  ...     Fare Cabin  Embarked
0            1         0       3  ...   7.2500   NaN         S
1            2         1       1  ...  71.2833   C85         C
2            3         1       3  ...   7.9250   NaN         S
3            4         1       1  ...  53.1000  C123         S
4            5         0       3  ...   8.0500   NaN         S
2. Checking for NULL Values in the dataset
tit.isnull().sum()

PassengerId      0
Survived         0
Pclass           0
Name             0
Sex              0
Age            177
SibSp            0
Parch            0
Ticket           0
Fare             0
Cabin          687
Embarked         2
dtype: int64
Treating the NULL Values.
Replacing the NULL values in the “Age” column with the average age of people in the ship
tit['Age']=tit['Age'].fillna(tit.Age.mean())
Replacing the NULL values in the “Embarked” column with the value C.
Filtering the NULL Values - tit[tit['Embarked'].isnull()]

     PassengerId  Survived  Pclass  ...  Fare Cabin  Embarked
61            62         1       1  ...  80.0   B28       NaN
829          830         1       1  ...  80.0   B28       NaN

(Port of Embarkation) tit['Embarked'].fillna('C',inplace=True)
Replacing the NULL values in the “Cabin” column with OT (Others)
tit['Cabin'].fillna('OT',inplace=True)
All the NULL values are treated.
tit.isnull().sum()

PassengerId    0
Survived       0
Pclass         0
Name           0
Sex            0
Age            0
SibSp          0
Parch          0
Ticket         0
Fare           0
Cabin          0
Embarked       0
dtype: int64
3. Cabin Columns Analysis
Changing the values in the cabin column to an understandable format. Getting the first letter of the values and saving it in a new column.
tit['Cabin'].value_counts()

OT             687
B96 B98          4
C23 C25 C27      4
G6               4
D                3
C49              1
B73              1
B39              1
C99              1
C103             1
Name: Cabin, Length: 148, dtype: int64

Creating a new column.
tit['cab']=tit['Cabin'].map(lambda x: x[0])

tit['cab'].value_counts()

O    687
C     59
B     47
D     33
E     32
A     15
F     13
G      4
T      1
Name: cab, dtype: int64
Converting the Cabin information to reserved & un-reserved.
Creating a new column.
tit['cabstatus']='Reserved'
tit['cabstatus'][tit['cab'].isin(['O'])]='UnReserved'

tit['cabstatus'].value_counts()

UnReserved    687
Reserved      204
Name: cabstatus, dtype: int64
- Combining (Siblings, Spouses) & (Parents, Children) Travelled into a single column.
tit['SC']=tit['SibSp']+tit['Parch']
tit['SC']

0      1
1      1
2      0
3      1
4      0
      ..
886    0
887    0
888    3
889    0
890    0
Name: SC, Length: 891, dtype: int64
Now converting the information into 2 groups, People travelled alone & People travelled as Group.
tit['boarding']=np.where(tit['SC']==0,'Alone','Group')

tit['boarding'].value_counts()
Alone    537
Group    354
Name: boarding, dtype: int64
4. “Name” column processing
tit['Name'].head()

0                              Braund, Mr. Owen Harris
1    Cumings, Mrs. John Bradley (Florence Briggs Th...
2                               Heikkinen, Miss. Laina
3         Futrelle, Mrs. Jacques Heath (Lily May Peel)
4                             Allen, Mr. William Henry
Name: Name, dtype: object
Splitting the “Prefix” from the name and saving it into a new column.
tit['prefix']=tit['Name'].map(lambda x:x.split(',')[1].split('.')[0].strip())
Now splitting the children (Prefix = Master, Miss) from the Name column.
tit['children']='adt'
tit['children'][(tit['prefix'].isin(['Master']))|(tit['Age']<15)]='child'
tit['children'][(tit['prefix'].isin(['Miss']))&(tit['Age']<15)]='child'

Filtering the age data in which the null values in the age column was earlier replaced with "Average Age" in ship with children who are 15 or less.
tit['children'][(tit['Age']==29.699118) & (tit['prefix']=='Miss')]='child'
tit['children'][(tit['Age']==29.699118) & (tit['prefix']=='Master')]='child'

tit['children'].value_counts()
adt      808
child     83
Name: children, dtype: int64
Children are more likely to survive the trip than other category. More than 50% of the children survived.
pd.crosstab(tit['children'],tit['Survived'])

Survived    0    1
children
adt       514  294
child      35   48
5. Getting Dummies from the newly created column for “ML Algorithms”
Getting dummies for “Embarked (Port of Embarkation)”.
e=pd.get_dummies(tit['Embarked'])
tit=pd.concat([tit,e],axis=1)
Getting dummies for “Gender”.
s=pd.get_dummies(tit['Sex'])
tit=pd.concat([tit,s], axis=1)
Getting dummies for “Cabin (Reserved or Un-Reserved)”
c=pd.get_dummies(tit['cabstatus'])
tit=pd.concat([tit,c],axis=1)
Getting dummies for “People Boarded (Alone or Group)”
bo=pd.get_dummies(tit['boarding'])
tit=pd.concat([tit,bo],axis=1)
Getting dummies for “Children”
ch=pd.get_dummies(tit['children'])
tit=pd.concat([tit,ch],axis=1)
I repeated the same Exploratory Data Analysis for the “Test Data Set” and determined the X & Y Values. Now everything was ready to run the Machine Learning Algorithms and check my score in Kaagle for which I was exicted.
Imported the Data Set.
X=tit[['Age','Pclass','male','Alone','C','Q','Reserved','child']]
y=tit[['Survived']]
SVC Machine Learning Algorithm
First I tried with the SVC Machine Learning Algoritm.
#Splitting the dataset into the Training set and Test set
from sklearn.model_selection import train_test_split
X_train,X_test,y_train,y_test = train_test_split(X, y, test_size=0.2, random_state=0)

#Fitting SVC to the Training set
from sklearn.svm import SVC
model_svc = SVC(C=1,kernel = 'rbf', random_state = 0)
model_svc.fit(X_train, y_train)

# Predicting the Test set results
pred=model_svc.predict(X_test)

# Prediction Accuracy
print("The train accuracy " , model_svc.score(X_train,y_train)*100)
print("The test accuracy " ,model_svc.score(X_test,y_test)*100)

The train accuracy  82.16
The test accuracy  80.44

#Persist a model
from sklearn.externals import joblib
joblib.dump(model_svc, 'titanic.joblib')
Applying the SVC Algorithm to the Test Data Set.
te=tac[['Pclass','male','Alone','C','Q','Reserved',True]]
from sklearn.externals import joblib
tests=joblib.load('titanic.joblib')
pred=tests.predict(te)
tac['Survived']=pred
output=tac[['PassengerId','Survived']]
Saving the output into an excel sheet.
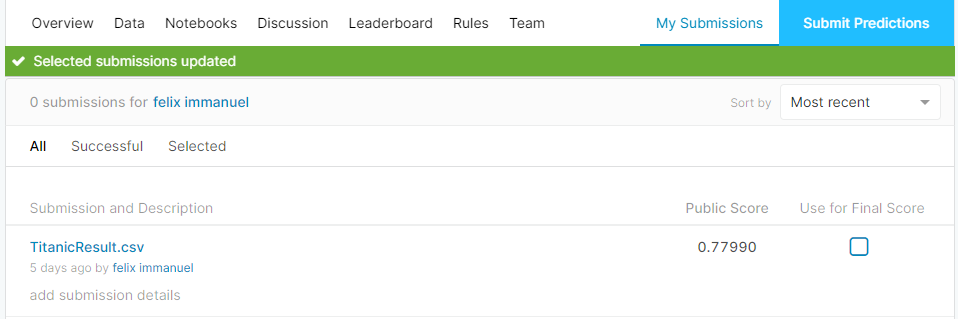
output.to_csv("E:\Data Science\Data\TitanicResult.csv", index=False)
Here is my test result of SVC Algorithm
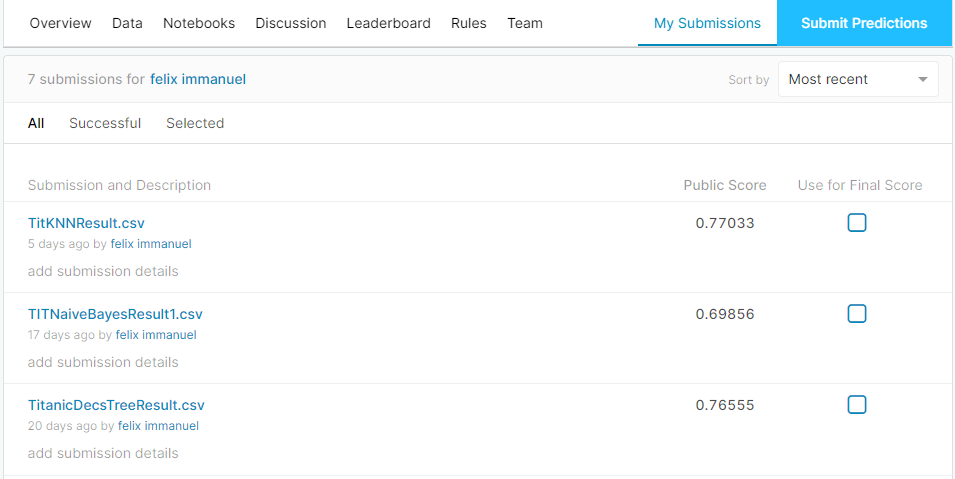
Test Results on other Algorithms
After trying various algorithms, my wasn’t improved.
Atlast I Tried Random Forest Algorithm
from sklearn.model_selection import train_test_split
X_train,X_test,y_train,y_test = train_test_split(X, y, test_size=0.2, random_state=0)

# Fitting Random Forest Classification to the Training set
from sklearn.ensemble import RandomForestClassifier
ranfor = RandomForestClassifier(n_estimators = 50, criterion = 'gini', random_state = 0)
ranfor.fit(X_train, y_train)

# Predicting the Test set results
y_pred = ranfor.predict(X_test)

print("The train accuracy " ,ranfor.score(X_train,y_train)*100)
print("The test accuracy " ,ranfor.score(X_test,y_test)*100)

The train accuracy  93.18
The test accuracy  78.21

#Persist a model
from sklearn.externals import joblib
joblib.dump(ranfor, 'titRF.joblib')
Applying the Random Forest Algorithm to the Test Data Set.
from sklearn.externals import joblib
ranforest=joblib.load('titRF.joblib')
pre=ranforest.predict(te)
tac['Survived']=pre
output=tac[['PassengerId','Survived']]

Saving the output into an excel sheet.
output.to_csv("E:\Data Science\Data\RandomForestResult.csv", index=False)
Atlast my score was little bit improved.
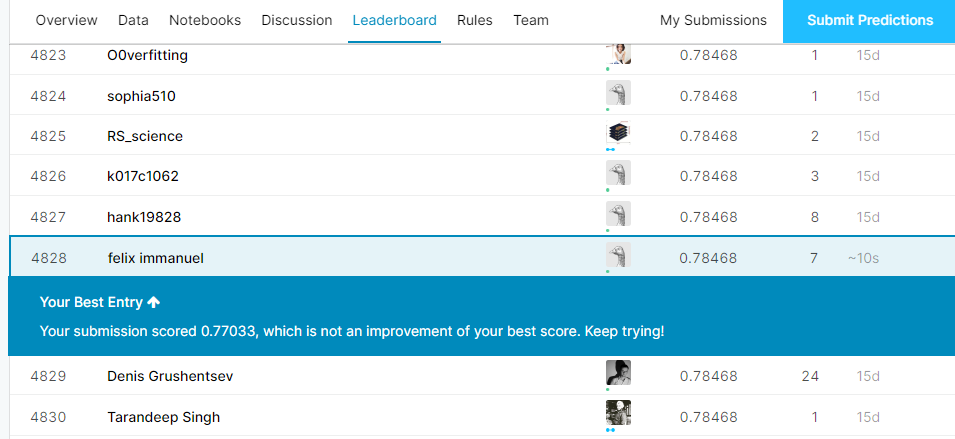
Still i’m analyzing and trying to improve my score!!!